Seeing seagrass in 3D
Drone-borne LiDAR maps eelgrass habitat and blue carbon
Trygve Heide | April 29th, 2026 | Stories
A new SeaBee study published in Remote Sensing shows, for the first time, how a flying drone carrying a green laser scanner can map an eelgrass meadow in three dimensions: bathymetry, canopy structure, biomass and above-ground carbon stock, all from a single morning of flying.
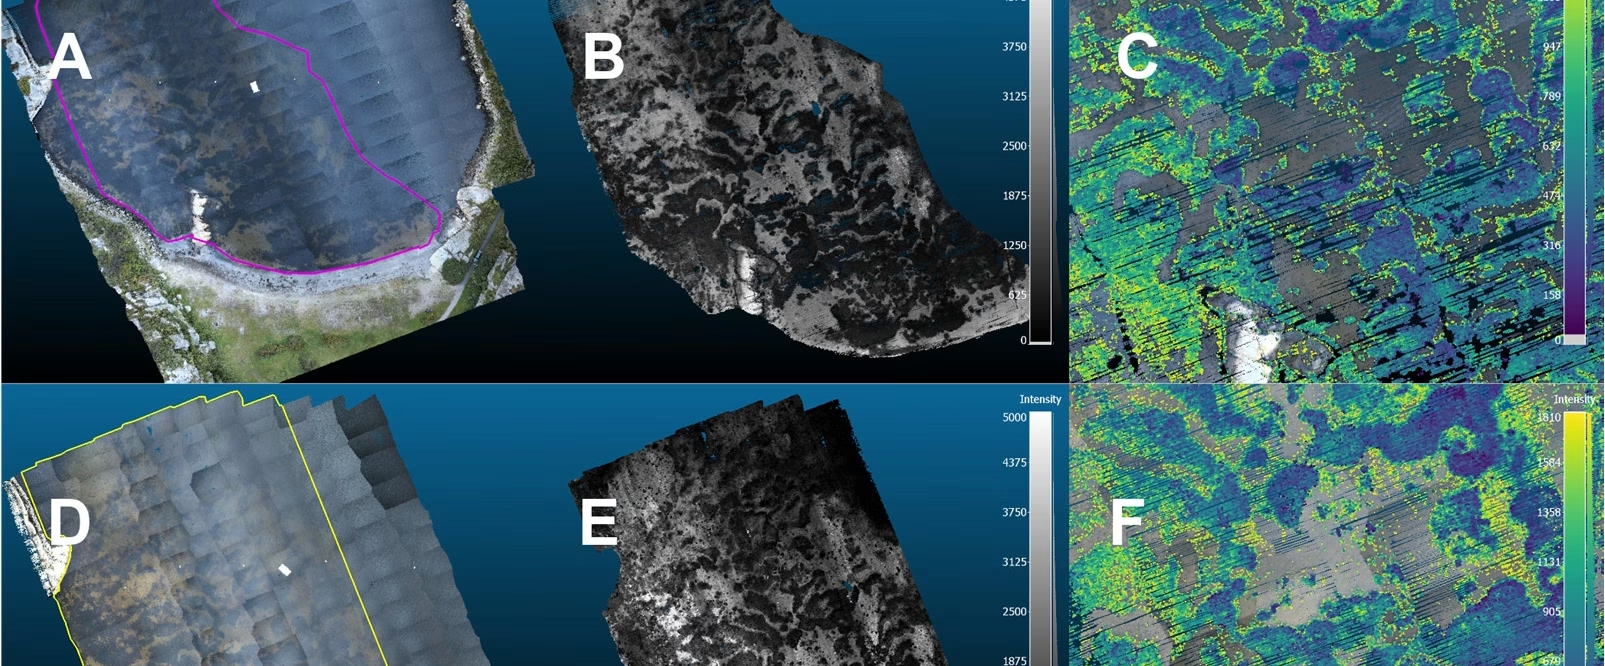
The team flew a YellowScan Navigator topobathymetric LiDAR on a Hexadrone Tundra 2 over a sheltered eelgrass (Zostera marina) meadow at Ølbergholmen in Vestfold County, at 25 m and 50 m altitude. After classifying the point cloud with a Random Forest model, the authors built a Digital Terrain Model of the sea floor and a Digital Surface Model of the canopy. Subtracting one from the other gives canopy height; multiplying by area gives volume. Validation against RTK GNSS measurements showed mean vertical errors as low as 0.5 cm.
Across the small study area, the methods allowed us to estimate total volume and then carbon stock That is the first time this has been done for a marine habitat-forming species using drone-borne LiDAR. The approach sits in a useful place between satellites and SCUBA: reproducible, on-demand, centimetre-resolution 3D data of shallow vegetated habitats, including the canopy itself rather than only its footprint. The same method should extend to kelp forests, mussel and oyster reefs, and maerl beds.
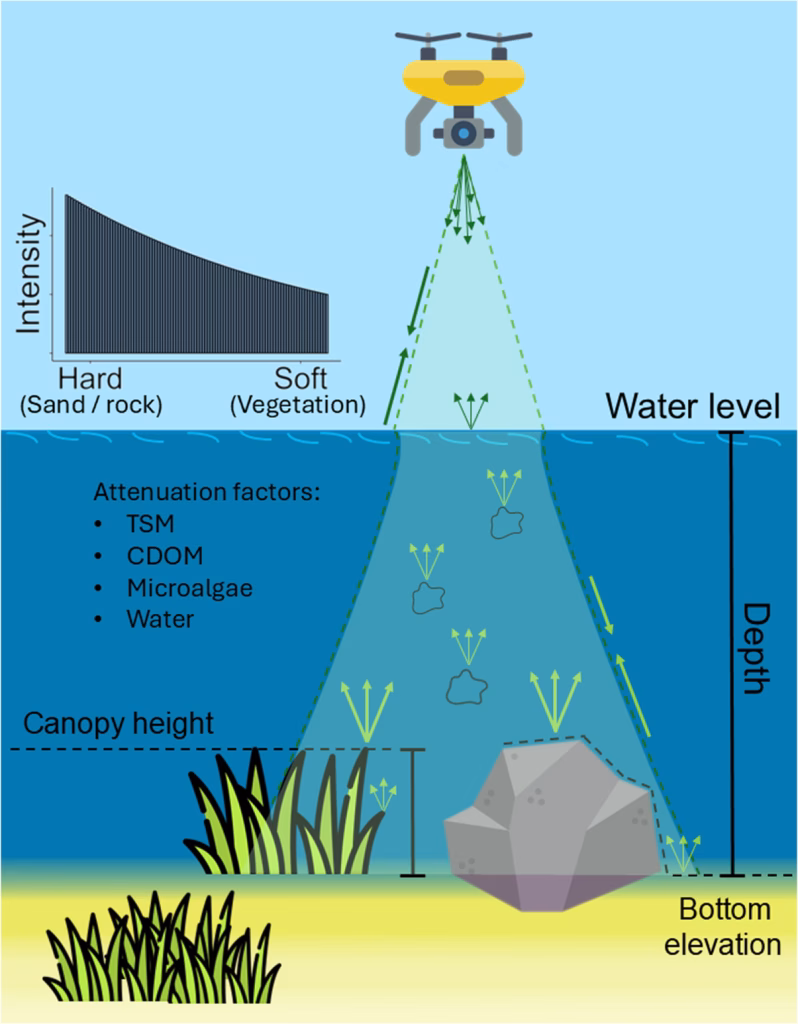
Schematic of drone-borne LiDAR system. Note that laser reflections can occur from the
sea floor as well as from suspended particles. Laser attenuation is therefore influenced by water
characteristics such as total suspended matter (TSM), coloured dissolved organic matter (CDOM),
and the presence of microalgae. By reaching the sea floor, the strength of the reflected signal (i.e.,
intensity) varies depending on substrate type between hard (e.g., sand, rock) and soft, absorptive
surfaces (i.e., vegetation).
Read the paper: Lavin, C.P., Buls, T., Poulsen, R.N., Gundersen, H., Kvile, K.Ø., Ødegaard, Ø.T., Hancke, K. (2026). High-Resolution Three-Dimensional Mapping of Eelgrass (Zostera marina) Habitat and Blue Carbon Using Drone-Borne LiDAR. Remote Sensing, 18, 1278. https://doi.org/10.3390/rs18091278